Page History
| Section | |
|---|---|
|
...
| Drawing
| Report
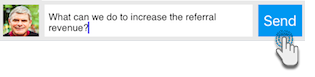
| Adding Report Comments
Enter your comment in the pop-up that appears and tap on Ok to save it
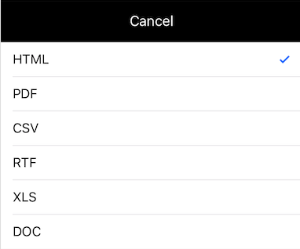
| Sharing
The following screen will appear Tap on Distribute to choose a distribution method
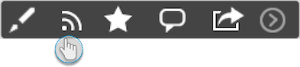
| Broadcast reports
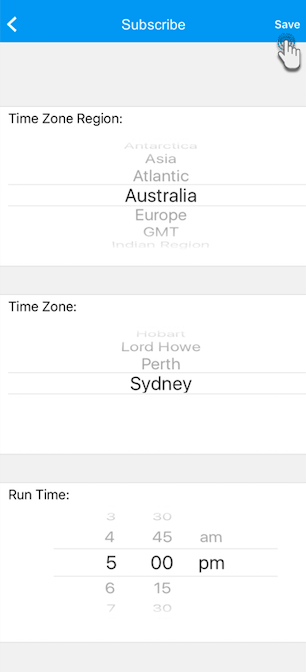
Now tap on the broadcast button The following screen will appear Tap on the first text field to change the subject of this broadcast Schedule the frequency with which to repeat this broadcast. (E.g: If the broadcast is set to be sent weekly, then select a week day) You can also set up advanced scheduling options. First, select the Advanced checkbox; a range of new fields will appear
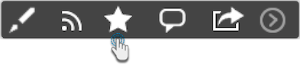
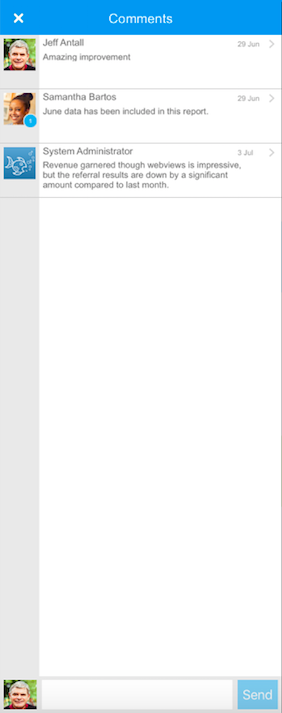
| Viewing Report Comments |
Follow the steps below to view and manage report comments: Choose the Comments option All the report comments will appear, provided there are any added
| Report Filters
|


|


...